THE GREAT OPT-OUT
When the System Stops Rewarding Participation, People Stop Participating

Last week, three economists at the same bank published three separate pieces of analysis. Together, they accidentally proved something none of them were willing to say.
The first was Satish Ranchhod, Senior Economist at Westpac New Zealand. He posted a chart tracking consumer prices since 2002. The headline: CPI up 83% over 23 years. Roughly 2.5% a year. Manageable. Contained. Exactly what the inflation-targeting framework was designed to deliver.
But the chart didn’t stop at the headline. Underneath it, the lines fanned out like cracks in a windscreen. Council rates: +300%. Building costs: +224%. Household energy: +173%. Insurance: +150%. Rent: +88%. Food: +85%.
Below the CPI line — the things pulling the “average” down — recreation, furnishings, clothing. And at the very bottom, communications at -31%. Your phone plan got cheaper. Your ability to keep the lights on did not.
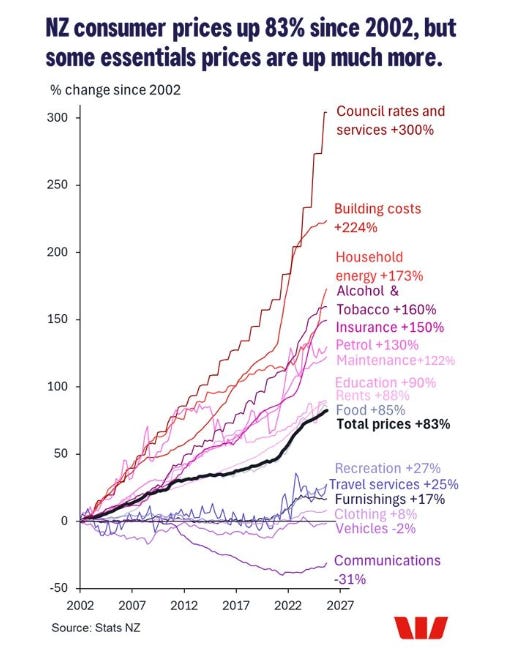
Satish, to his credit, named the tension. Households don’t feel like they’re getting ahead because the cost of essentials is squeezing out everything else. He’s right. But the chart says something bigger than that.
The second was Kelly Eckhold, Westpac’s Chief Economist — Satish’s boss. His response to the chart was a single line: “Your cell phone won’t keep you warm in the winter or satisfy your hunger. Just as well average weekly earnings are up 137% over the same period.”
Wages up 137%. CPI up 83%. Case closed. Workers are ahead.
Except they’re not. And his own colleague’s chart is the proof. When I pointed out that 137% wage growth doesn’t touch council rates at +300%, building costs at +224%, or energy at +173%, Kelly’s response was that wage demands adjust to reflect inflation over time — an equilibrium that insulates households “over the medium run.”
The medium run. That’s the tell. Because in the medium run, a generation of young New Zealanders has watched housing become a 7x income proposition, deferred starting families, and increasingly opted out of a labour market that can’t offer them what it promised their parents. The equilibrium Kelly describes requires a labour market with bargaining power. With unemployment at 5.4% and youth unemployment at 13-15%, that labour market doesn’t exist.
When pressed further, Kelly’s final response was: “Wages have risen ahead of the CPI so it’s not the case that wage growth is limited by that.” The same assertion, restated. No engagement with the gap between CPI and essentials. No acknowledgment that his own team’s data contradicts the headline he’s defending.
The third was Michael Gordon, another Westpac Senior Economist, who published a piece titled “The Houseless Recovery” — exploring whether New Zealand’s economy can recover without rising house prices. It’s a reasonable institutional question. But it reveals the frame. The concern isn’t that a generation can’t afford to live in a house. The concern is that the economy might not grow if house prices don’t.
Three economists. Same bank. Same week. One publishes a chart showing essentials have outpaced headline inflation by 2-4x. Another argues wages beat CPI so households are fine. A third asks if the economy can function without further house price growth — never asking whether it can function when the entry price is already seven times income.
This isn’t a conspiracy. It’s something more mundane and more dangerous: institutional blindness. The metrics they use — CPI, average wages, GDP — were designed for a different era. They still work beautifully as descriptions of an economy. They just no longer describe the experience of living in one.
If this were only a New Zealand problem, it would be a New Zealand conversation. It isn’t.
The Same Pattern, Everywhere
Within days of Satish’s chart going up in New Zealand, Elliott McArthur — an independent writer in Australia — rebuilt the same analysis using Australian Bureau of Statistics data from the same period. The results were almost interchangeable:
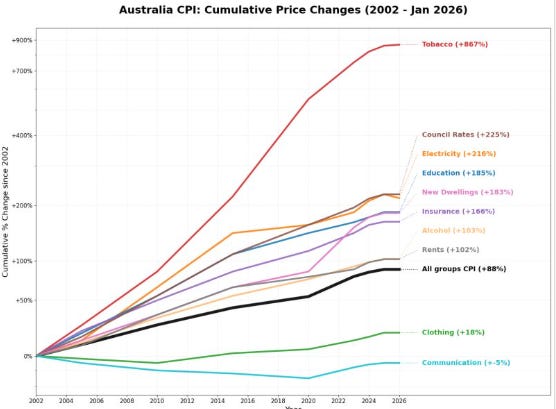
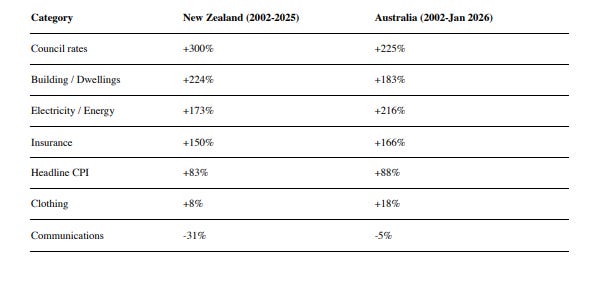
Two countries. Two independent datasets. Two national statistics offices. The same structural divergence: essentials running at double or triple the headline while imported discretionary goods drag the average down.
As Elliott put it: this isn’t inflation. It’s a structural shift in what it costs to exist.
Now look at what’s happening to young people across every economy where this pattern holds:
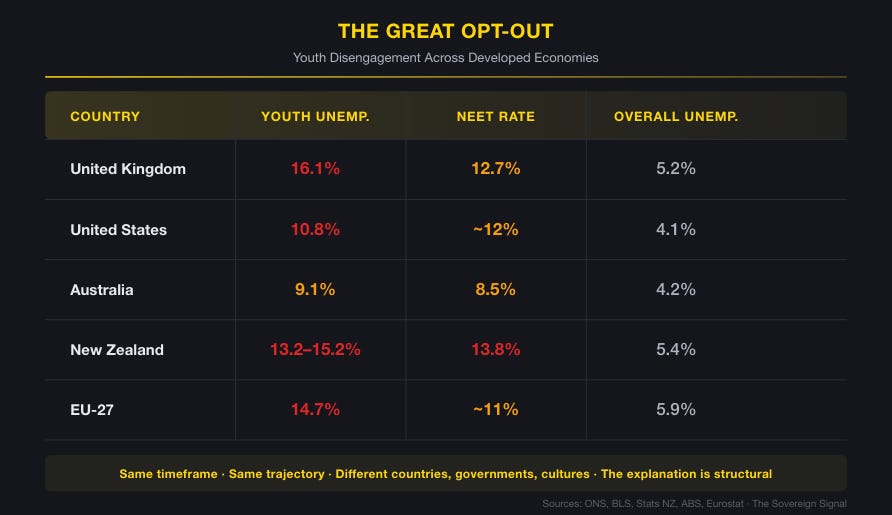
UK youth unemployment now sits at 16.1% — above the European average for the first time since records began. In the United States, two-thirds of male NEETs — young people not in employment, education or training — have stopped looking for work entirely, up from 40% in 1990. In New Zealand, youth unemployment runs 10 percentage points above Australia’s, turning brain drain into a brain flood. One in four working-age people in the UK is not working.
Same timeframe. Same trajectory. Different countries, different governments, different welfare systems, different cultures. You don’t get simultaneous disengagement across the Anglosphere and Europe from TikTok and avocado toast.
When the identical pattern appears across five distinct economies, the explanation is structural. Not cultural. Not generational. Structural.
The Mainstream Explanation — And What It Misses
The usual suspects get wheeled out whenever this data surfaces. Mental health crisis. COVID aftershocks. Cultural shifts and generational entitlement. Social media and the attention economy. Welfare dependency.
None of these are wrong. All of them are incomplete. They describe symptoms and mistake them for causes.
The mental health data is real and it’s devastating. In the UK, 2.81 million people are economically inactive due to long-term sickness — up 721,000 from pre-pandemic levels, with 53% citing depression or anxiety. The Keep Britain Working Review found that young people with mental health conditions are 4.7 times more likely to be economically inactive. The UK now has 8.7 million people with work-limiting health conditions, up 2.5 million — 41% — in a single decade.
But here’s the question the mainstream framing never reaches: why now? Why everywhere? Why simultaneously across economies with different healthcare systems, different welfare structures, different cultural attitudes to work?
A mental health epidemic doesn’t spontaneously erupt across five continents at the same moment. But an economic system that progressively removes the incentive to participate — that erodes the link between effort and outcome, year after year, across every economy running the same monetary playbook — would produce exactly this pattern. Economic despair doesn’t show up in the data as “rational response to broken incentives.” It shows up as depression, anxiety, and withdrawal.
The inactivity charts aren’t showing what’s wrong with young people. They’re showing what’s wrong with the system young people are being asked to join.
The Broken Incentive
Three forces have converged to void the social contract that underpinned the post-war developed world: work hard, save money, buy a house, raise a family, retire with dignity. Each one is measurable. Together, they explain the opt-out.
The Locked Gate: Housing Financialisation
For the first time in the 21-year history of the Demographia International Housing Affordability survey, the 2025 edition recorded zero affordable major housing markets globally. Not one.
The standard measure is the median multiple — median house price divided by median household income. Anything above 3.0 is considered unaffordable. Before 1990, most Anglosphere markets sat at or below that line. Today: the US national median is 4.8. The UK is 5.6. Canada is 5.4. Sydney is 13.8. Auckland is around 7. London roughly 8.
In New Zealand, the house price to earnings ratio went from 3.0 in 2002 to 6.8 in 2025. Infometrics data shows it moved from 4.2x in 1989 to 11.1x in 2024. Toronto sat below 4.0 from 1971 to 2004. It’s now 8.4.
This is the locked gate. Housing was the primary mechanism through which ordinary people built wealth in the 20th century. It was the reward for participation. When the median house costs 7-13 times the median income, the reward is gone. The gate is shut. And the generation standing outside it can do the arithmetic.
Michael Gordon’s “Houseless Recovery” asks whether the economy can recover without house price growth. The question the locked-out generation is asking is simpler: why would I work 40 hours a week in a system where the entry price for stability rises faster than anything I can earn?
The CPI Deception: Measured vs. Experienced Inflation
Satish’s chart and Elliott’s mirror tell the same story from two hemispheres. The mechanism is straightforward and it’s global.
Globalised manufacturing and technology deflation have driven down the cost of discretionary, tradeable goods — clothing, electronics, vehicles, communications. These categories pull the headline CPI down. Meanwhile, domestically-driven essentials — housing, energy, insurance, rates, healthcare, education — are driven by local land costs, regulatory costs, infrastructure deficits, and monopolistic pricing. They don’t benefit from global competition. They only go up.
The CPI captures both categories in a single number. The number looks contained. The lived experience doesn’t match. This isn’t a measurement error. The CPI does exactly what it was designed to do. The problem is that what it was designed to do no longer captures what matters.
Kelly Eckhold’s argument — wages at +137% have outpaced CPI at +83%, therefore households are insulated — is technically correct and experientially meaningless. Wages haven’t outpaced council rates (+300%), or building costs (+224%), or energy (+173%), or insurance (+150%). The headline says workers are ahead. The household budget says otherwise.
OECD data confirms this isn’t an Australasian quirk. Across the OECD, housing costs outpaced incomes by 17.8% over a single decade. The worst cases: Portugal at +53 percentage points, Canada at +41, the United States at +31.
When every central bank targets a CPI that structurally understates the cost of essentials, and every wage negotiation references that same CPI, the gap between official reality and lived reality widens every year. This is the engine of disillusionment.
The Hidden Tax: Currency Debasement
Since 1971, when the US severed the dollar’s link to gold, every major fiat currency has lost between 95% and 98% of its purchasing power measured against gold. That’s not a talking point. It’s arithmetic.
The mechanism is simple. Governments spend more than they collect. They borrow the difference. Central banks accommodate the borrowing by expanding the money supply. The currency loses purchasing power. The process is slow enough to be invisible year-to-year and devastating over a career.
Global debt now stands at $348 trillion — a record, after $29 trillion was added in 2025 alone in the fastest yearly build-up since the pandemic. US federal debt alone is $38 trillion — roughly 125% of GDP — with annual interest payments exceeding $1.1 trillion and rising. Every developed economy faces the same trilemma: default on the debt (won’t happen), impose austerity to pay it down (politically impossible), or debase the currency to make the debt manageable in nominal terms. Debasement is the revealed preference of every major government. It’s not a conspiracy. It’s the path of least resistance.
For savers, debasement is a hidden tax. Your bank pays you 3-4% on deposits while inflation — real inflation, not the CPI version — runs at 5-8% on the things you actually need. The spread between what your money earns and what your costs consume is the extraction mechanism. It’s invisible on any single bank statement and compounding over a lifetime.
For young people, it’s worse. They start with no assets. Their wages are negotiated against a CPI that understates their costs. The primary asset that historically offset debasement — property — is priced beyond reach. They’re standing in a current that pulls purchasing power away from them every year, with no anchor to hold onto.
This is the broken incentive. Not laziness. Not entitlement. Not mental health. A system that structurally transfers wealth from those who earn to those who own, from the young to the old, from the future to the present. When the reward for participation is systematically diluted, participation becomes optional.
The Feedback Loop
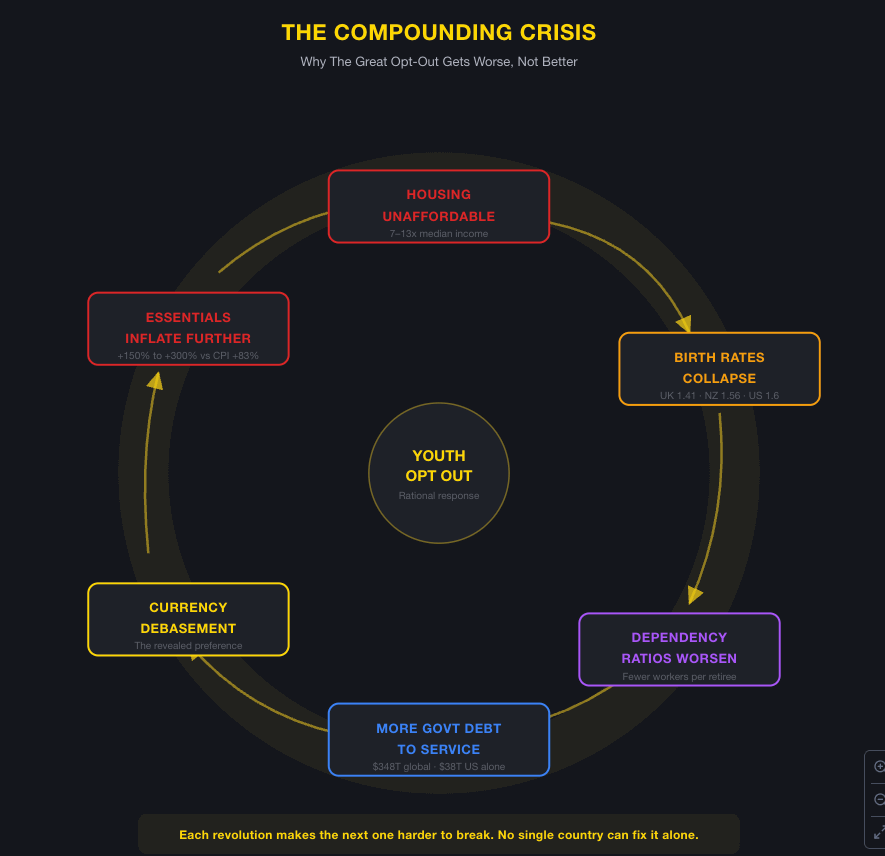
This isn’t cyclical. It compounds.
Young people can’t afford housing, so they defer family formation. Birth rates collapse — the UK at 1.41, Australia at 1.51, New Zealand at 1.56, the US at 1.6. All at or near record lows. All below the 2.1 replacement rate needed to maintain a stable population.
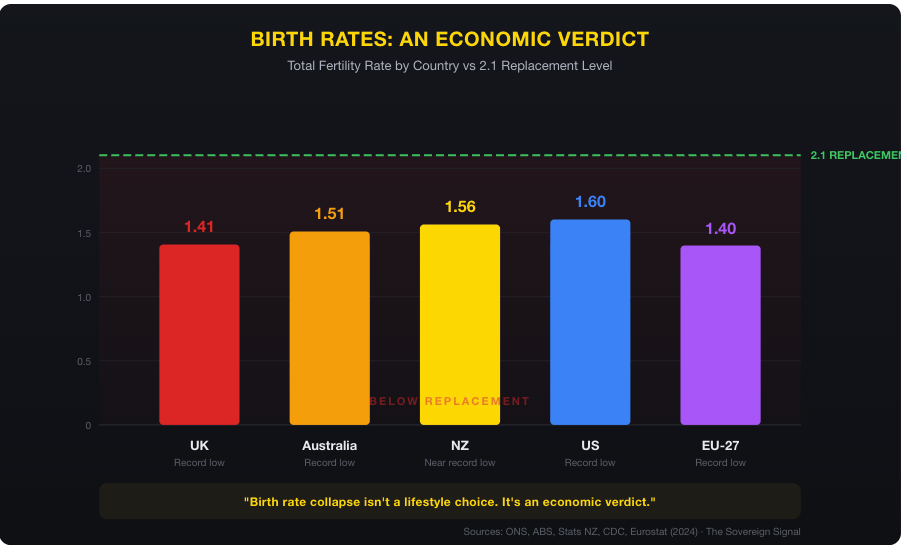
Birth rate collapse isn’t a lifestyle choice. It’s an economic verdict.
Fewer births mean worsening dependency ratios — fewer workers supporting more retirees. Retirement systems like KiwiSaver rely on future workers to fund current retirees. If those workers aren’t being born because their potential parents can’t afford housing, the system consumes itself.
Worsening dependency ratios demand more government spending. More spending requires more borrowing. More borrowing means more debt to service. More debt service means more pressure to debase. More debasement means the currency weakens further. A weaker currency means imported costs rise. Rising imported costs mean essentials inflate further. More inflation means the incentive structure breaks further. And more young people opt out.
Each revolution of this cycle makes the next one harder to break. No individual country can solve it unilaterally because the monetary system is global. New Zealand can’t fix debasement by cutting the OCR. The UK can’t solve it with a welfare review. The US can’t grow its way out while running trillion-dollar deficits on trillion-dollar interest payments.
The feedback loop is the reason this matters beyond the immediate data. Youth disengagement isn’t a policy problem to be managed. It’s a signal that the operating system is failing.
What Now
This isn’t a doom piece. Understanding a system is the prerequisite to navigating it.
The first step is seeing clearly. The gap between measured inflation and experienced inflation — between CPI and the actual cost of participation — is not a statistical curiosity. It’s the mechanism by which an entire generation is being priced out. Understanding that gap changes how you evaluate every headline, every policy announcement, every “wages are growing” reassurance from the economists.
The second step is positioning. If the system structurally transfers wealth from savers to borrowers, from cash holders to asset holders, from the young to the old — then the rational response is to position on the right side of that transfer. Not because you endorse it. Because you recognise it. Assets that benefit from monetary expansion rather than savings that are eroded by it. That’s not investment advice. It’s pattern recognition.
The third step is honesty. Financial struggle in this environment is not a personal failure. When the same pattern plays out across five economies — when a 25-year-old in Auckland faces the same locked gate as a 25-year-old in London, Toronto, Sydney, or Portland — the common variable isn’t individual character. It’s the system. Removing the shame narrative from financial difficulty is not soft. It’s accurate.
The Great Opt-Out isn’t a generation giving up. It’s a generation recognising that the rules changed and nobody told them.
The question isn’t how to force them back into a broken system. It’s whether we have the honesty to fix the system they’re walking away from.
The Sovereign Signal covers monetary policy, currency debasement, and financial sovereignty for ~10,000 readers who want to understand the system — not just survive it. If this piece reached you through someone else, you can subscribe